> ## Documentation Index
> Fetch the complete documentation index at: https://help.latchel.com/llms.txt
> Use this file to discover all available pages before exploring further.
# Using the Filters
> Filters make it simple to customize the view and get exactly what you need from your reports. This help guide provides steps on how property managers can filter results so you can focus only on the information that’s relevant to your goals.
Filters allow you to narrow down your analytics results to focus only on the information that matters most. In Latchel Analytics, you can filter data in three ways: **Date Range**, **Portfolio**, and **Owner**.
You can combine filters (e.g., Date Range + Portfolio + Owner) for more precise results.
### **Filtering by Date Range**
Go to the **Date Range** filter in your Analytics view. By default, it is set to **Auto date range**. Filtering by date gives you the option to click on the **Start Date**, and **End Date**.
In addition, you can also customize the date range by selecting:
* **Fixed**
* **Today**
* **Yesterday**
* **This month**
* **Last # days**
* **Advanced:** This option will ask you to enter a start and end date but with even more complex date range configuration as shown below:
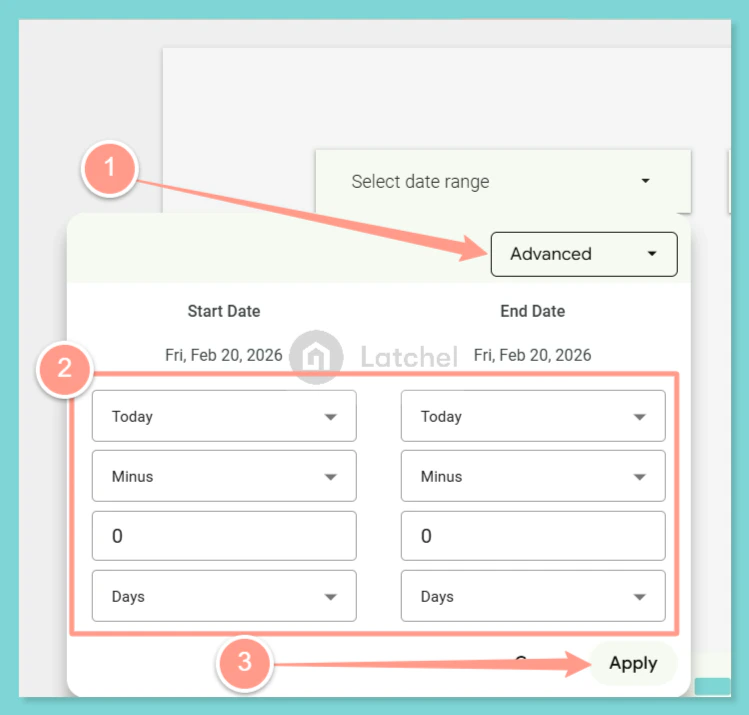 Depending on the date range you selected, the data will refresh to reflect your selected timeframe.
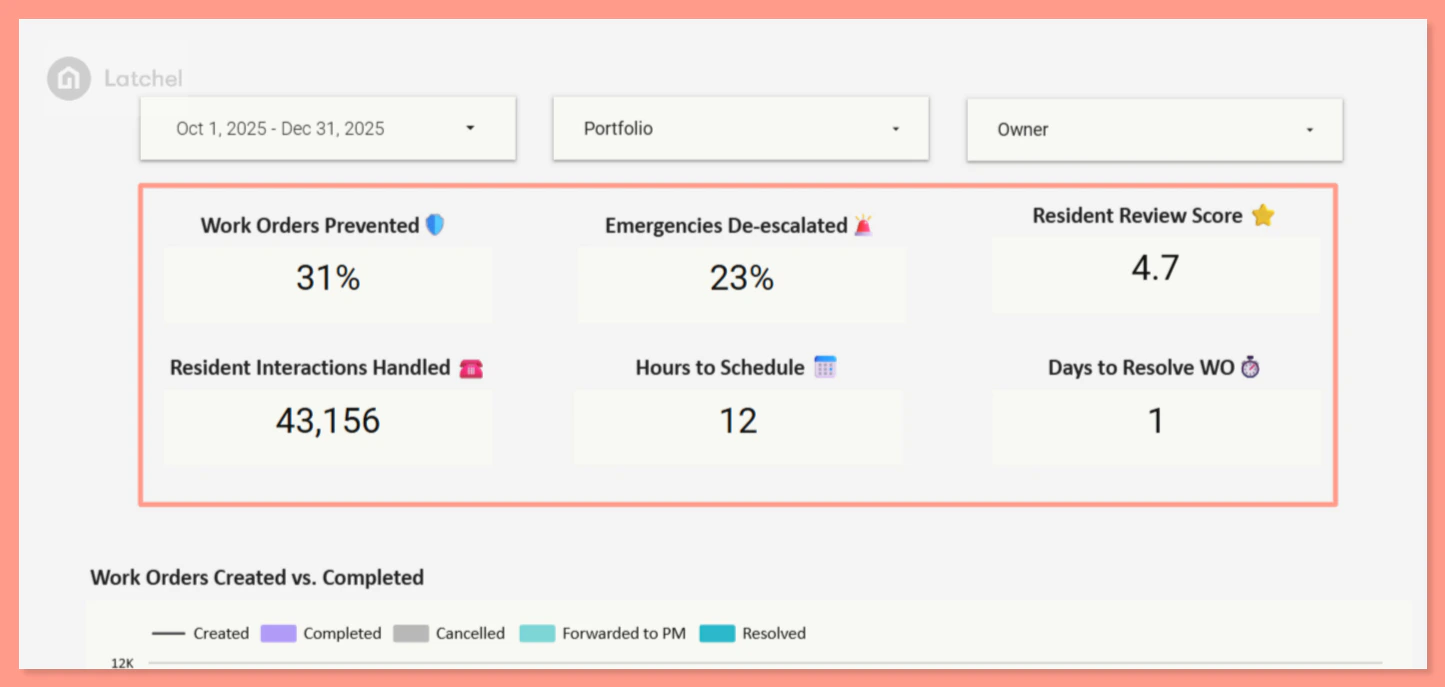 ### **Filtering by Portfolio**
Click the **Portfolio filter**. Then, **select one or more portfolios** from the list.
### **Filtering by Portfolio**
Click the **Portfolio filter**. Then, **select one or more portfolios** from the list.
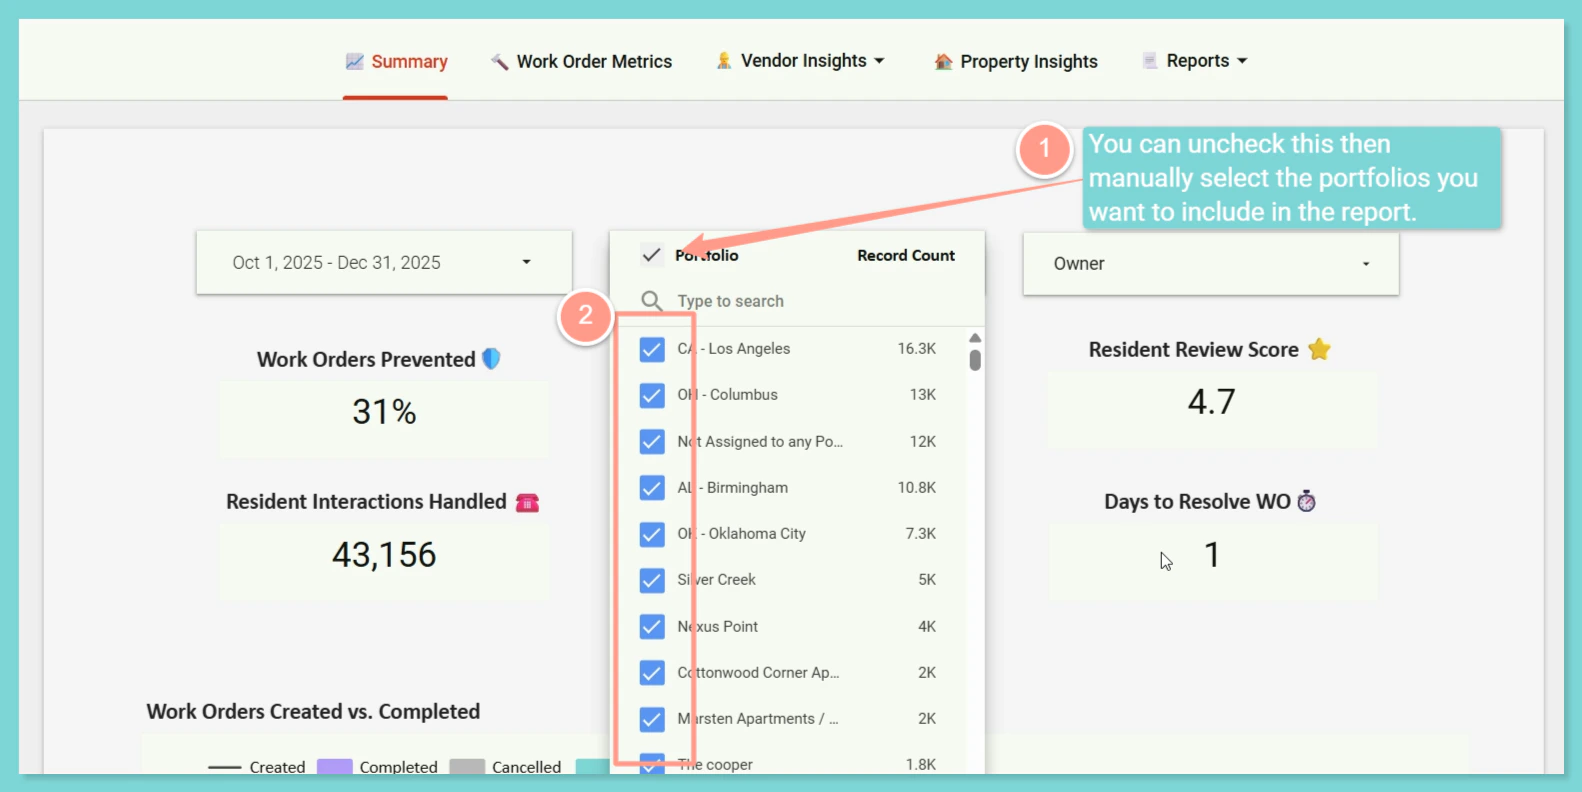 Results will automatically adjust to show data only for the chosen portfolio(s).
### **Filtering by Owner**
Click the **Owner filter**. Choose the **owner’s name** from the list.
Results will automatically adjust to show data only for the chosen portfolio(s).
### **Filtering by Owner**
Click the **Owner filter**. Choose the **owner’s name** from the list.
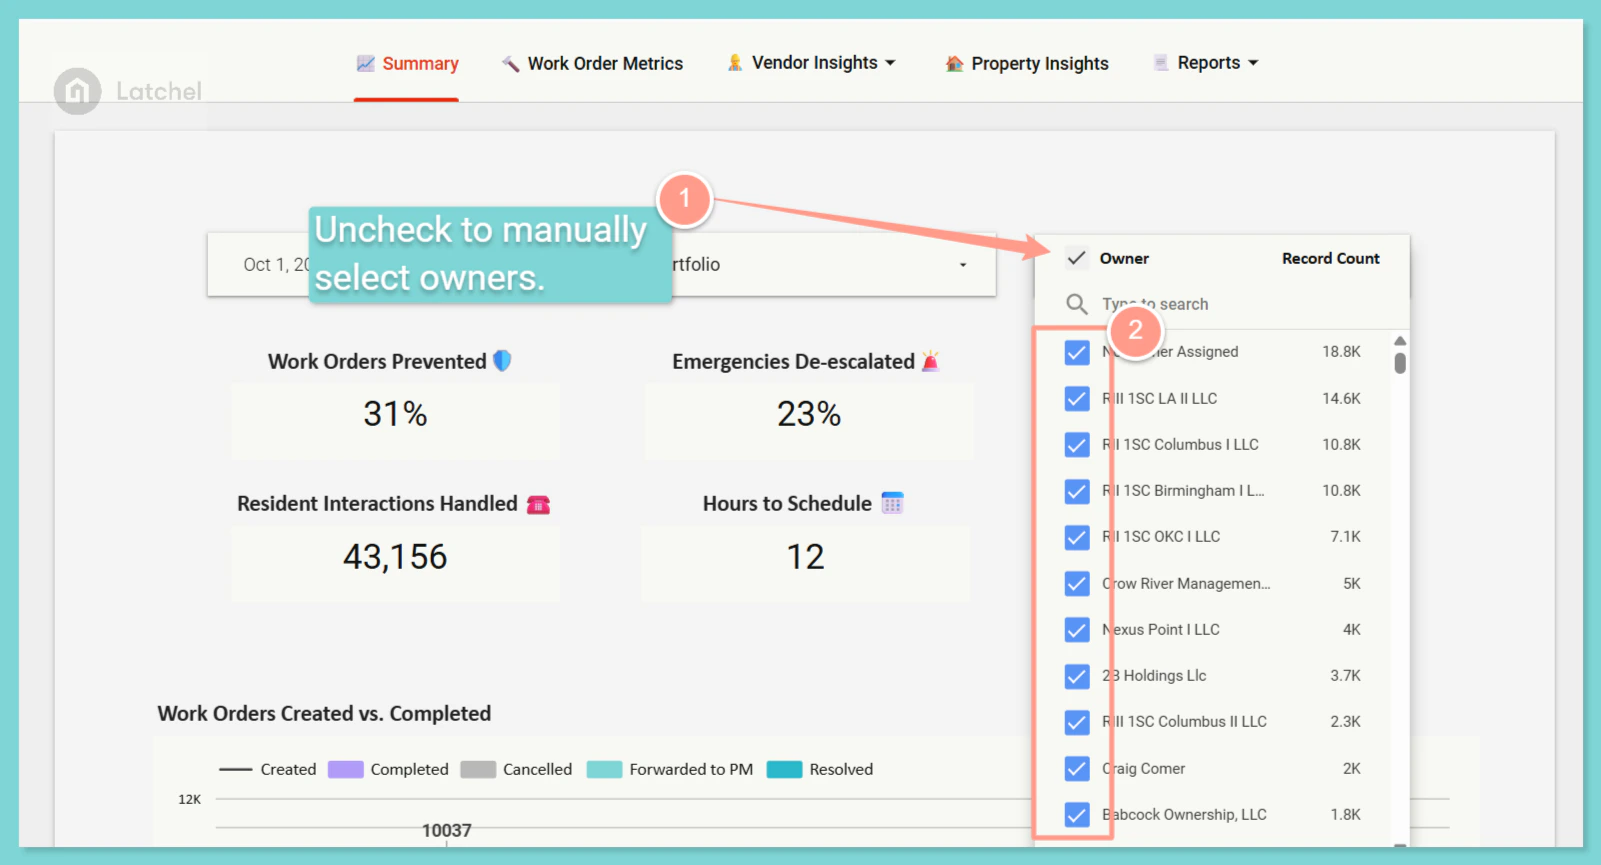 Analytics will update to display results specific to that owner.
### **Change Metric Components**
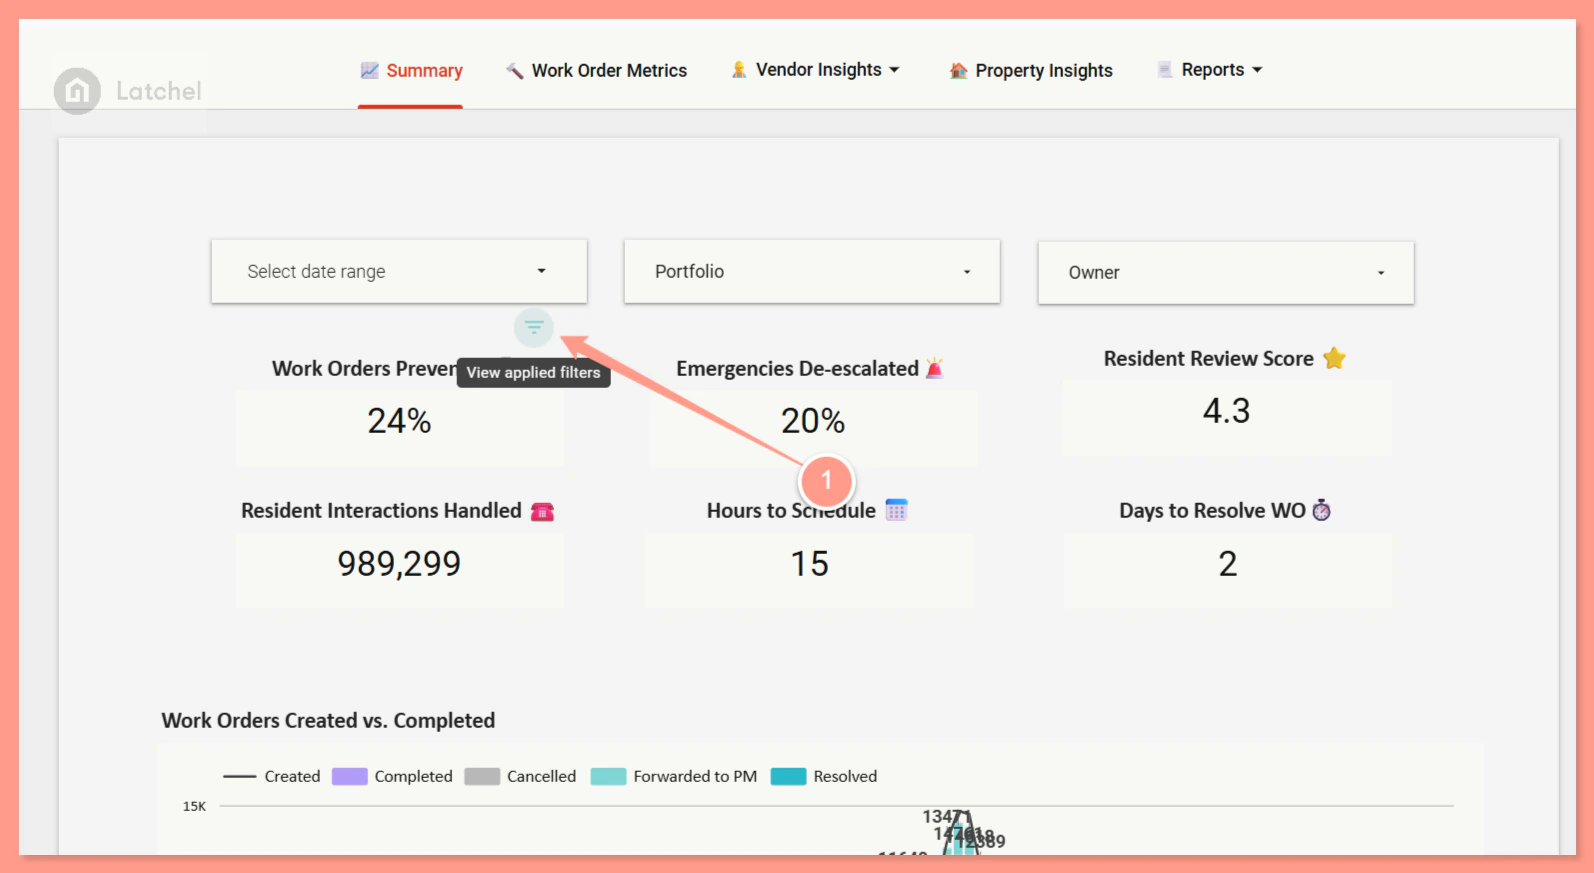
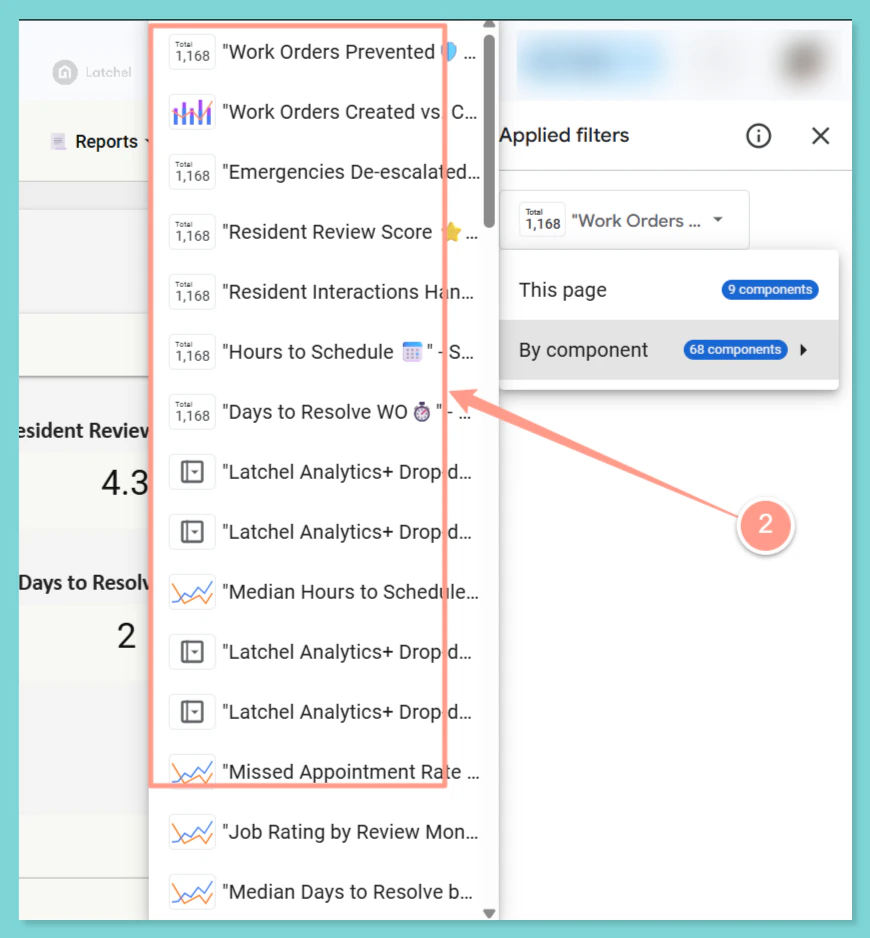
Each **key metric tile** on the dashboard **has its own filter option**. By clicking the filter, you can change the metric components that will show on your summary page. There are 68 components you can choose from.
Hover over or click the **filter icon** on a metric tile.
Analytics will update to display results specific to that owner.
### **Change Metric Components**
Each **key metric tile** on the dashboard **has its own filter option**. By clicking the filter, you can change the metric components that will show on your summary page. There are 68 components you can choose from.
Hover over or click the **filter icon** on a metric tile.
 Then, select for the components you would like to reflect on your summary page.
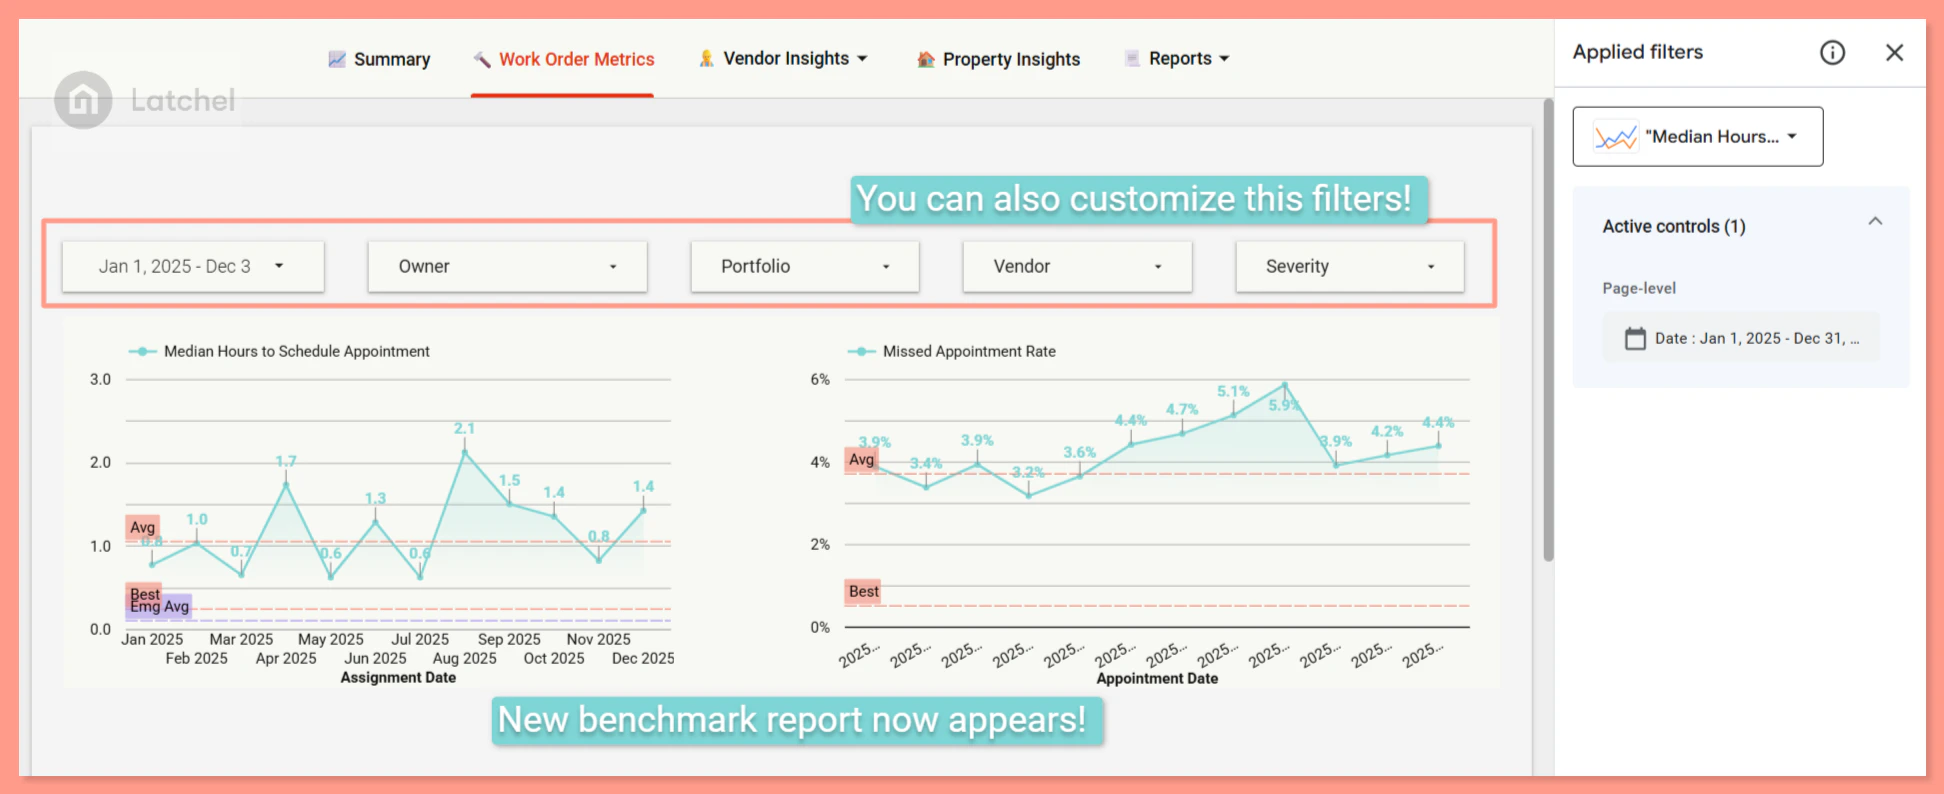
 In the example below, **Median Hours to Schedule Appointment** is selected. Notice that **new sets of Filters** appear on the screen which you can also customize to view the data you need.
 ### **Sorting**
You can also sort your metric to display the benchmark for your reports. Hover over the upper-left corner of the metric until the **Sort** option appears.
### **Sorting**
You can also sort your metric to display the benchmark for your reports. Hover over the upper-left corner of the metric until the **Sort** option appears.
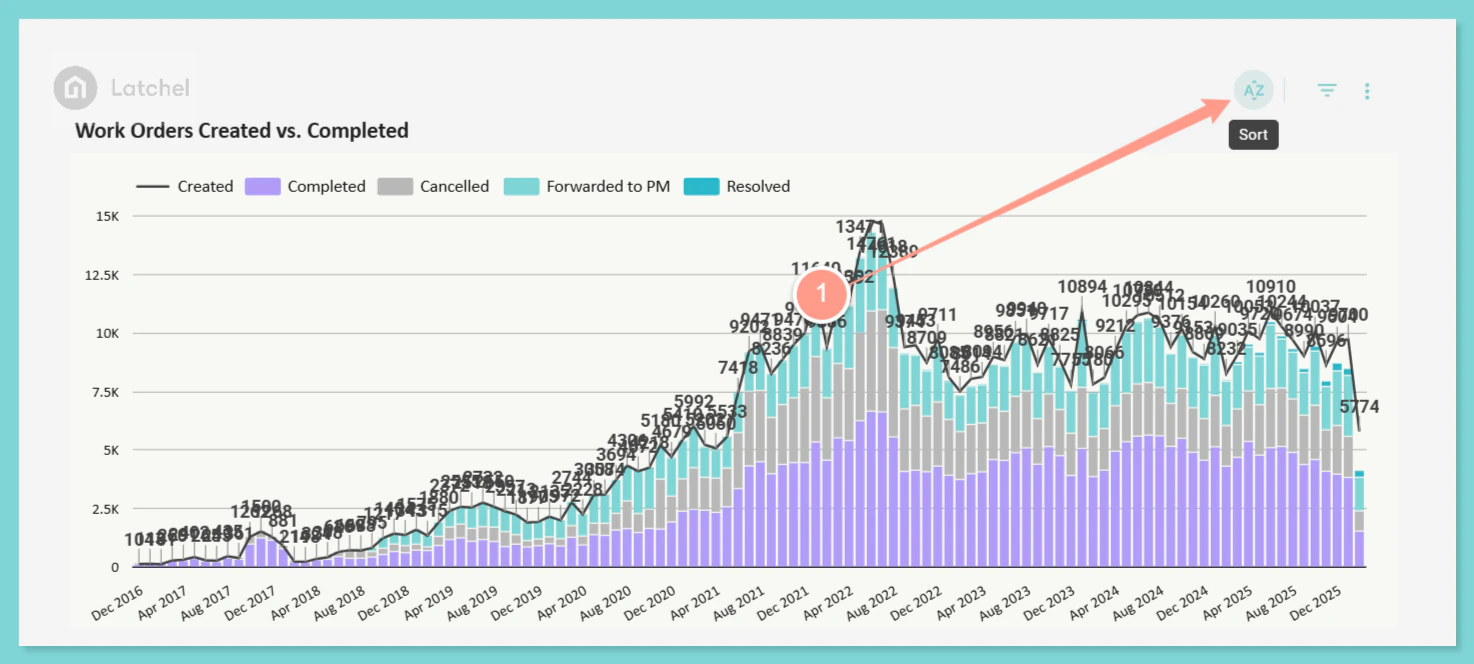 Click **Sort**, then select your preferred sorting option for the report.
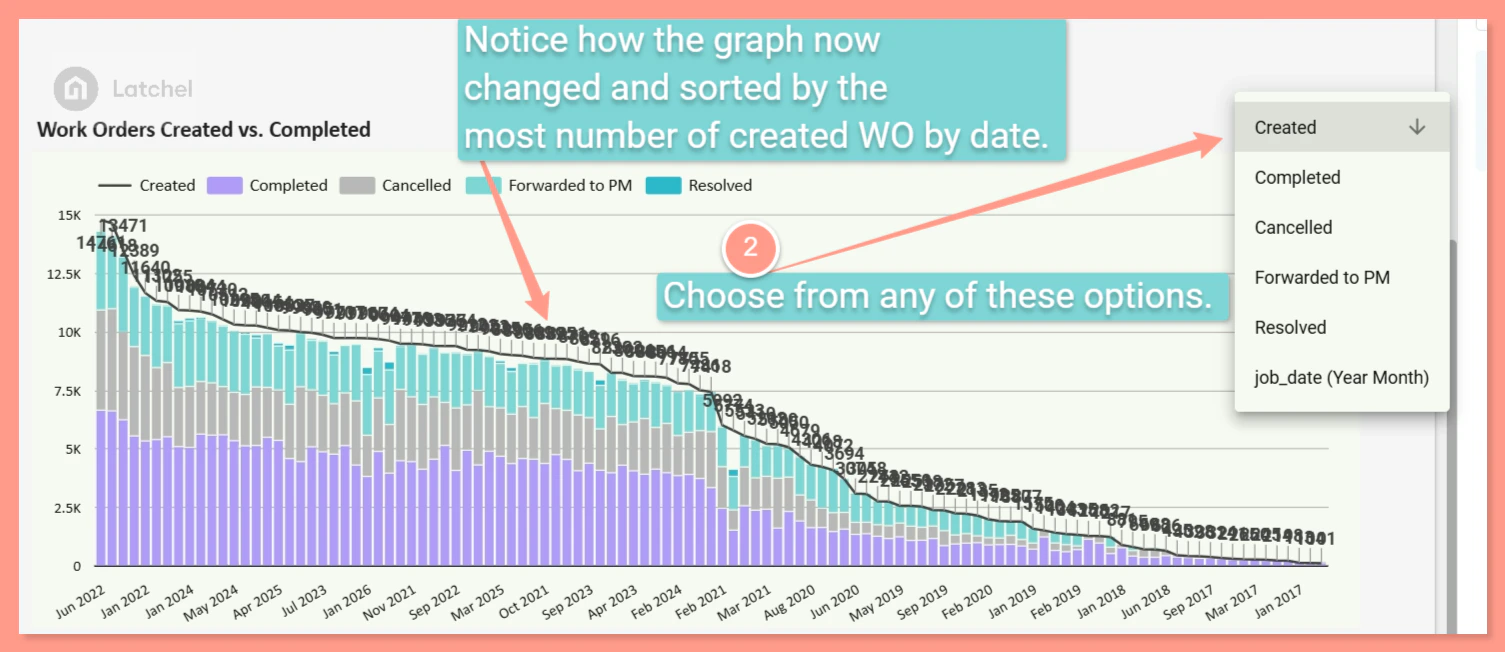 Changing the metric component, in addition to using the Filter and Sort options in Latchel Analytics, will display the benchmark for your reports.