The Expanded Analytics
Latchel Analytics has recently undergone a major update, including new functionality, UI changes, powered through Google Looker Studio. These changes significantly improve how property managers access, filter, and understand their data across their Latchel account. The Analytics dashboard is organized into different sections to help you monitor and evaluate your maintenance performance.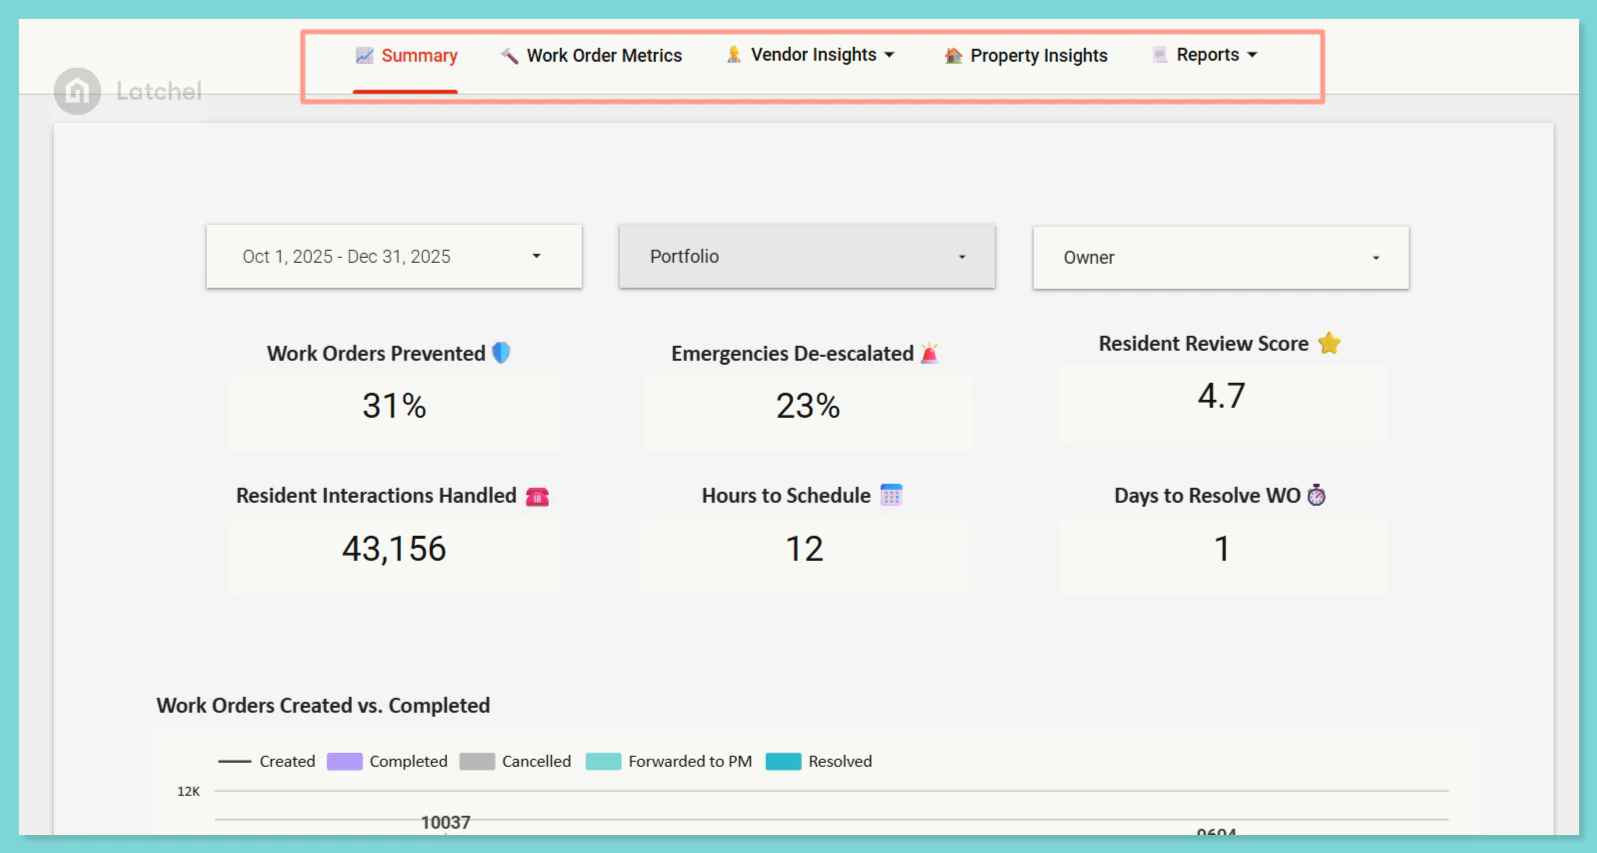
The Summary Section
This section contains the 7 key metrics displayed in the main dashboard summary cards and charts.Latchel Analytics: The Summary Section
Get to know more of about your Analytic’s Summary section via this guide.
Work Order Section
This section contains detailed work order queries and work order-specific metrics.Latchel Analytics: The Work Order Section
Explore this guide to better understand your work order performance metrics.
Vendor Insights Section
This section contains 4 key vendor performance metrics and insights.Latchel Analytics: Vendor Insights Section
Get a clear view of vendor performance with key metrics on scheduling, missed appointments, reviews, and work order resolution times.
Property Insights Section
This section contains 3 key property performance metrics and insights.Latchel Analytics: Property Insights Section
Quickly identify high-traffic properties, recurring issues, and emergency work order trends with Latchel’s Property Insights.
On-Call Scorecard
This provides a clear view of on-call performance, showing alerts received, acknowledged, missed, or ignored, along with no-show rates and response times—helping you evaluate responsiveness and accountability across your team or individual technicians.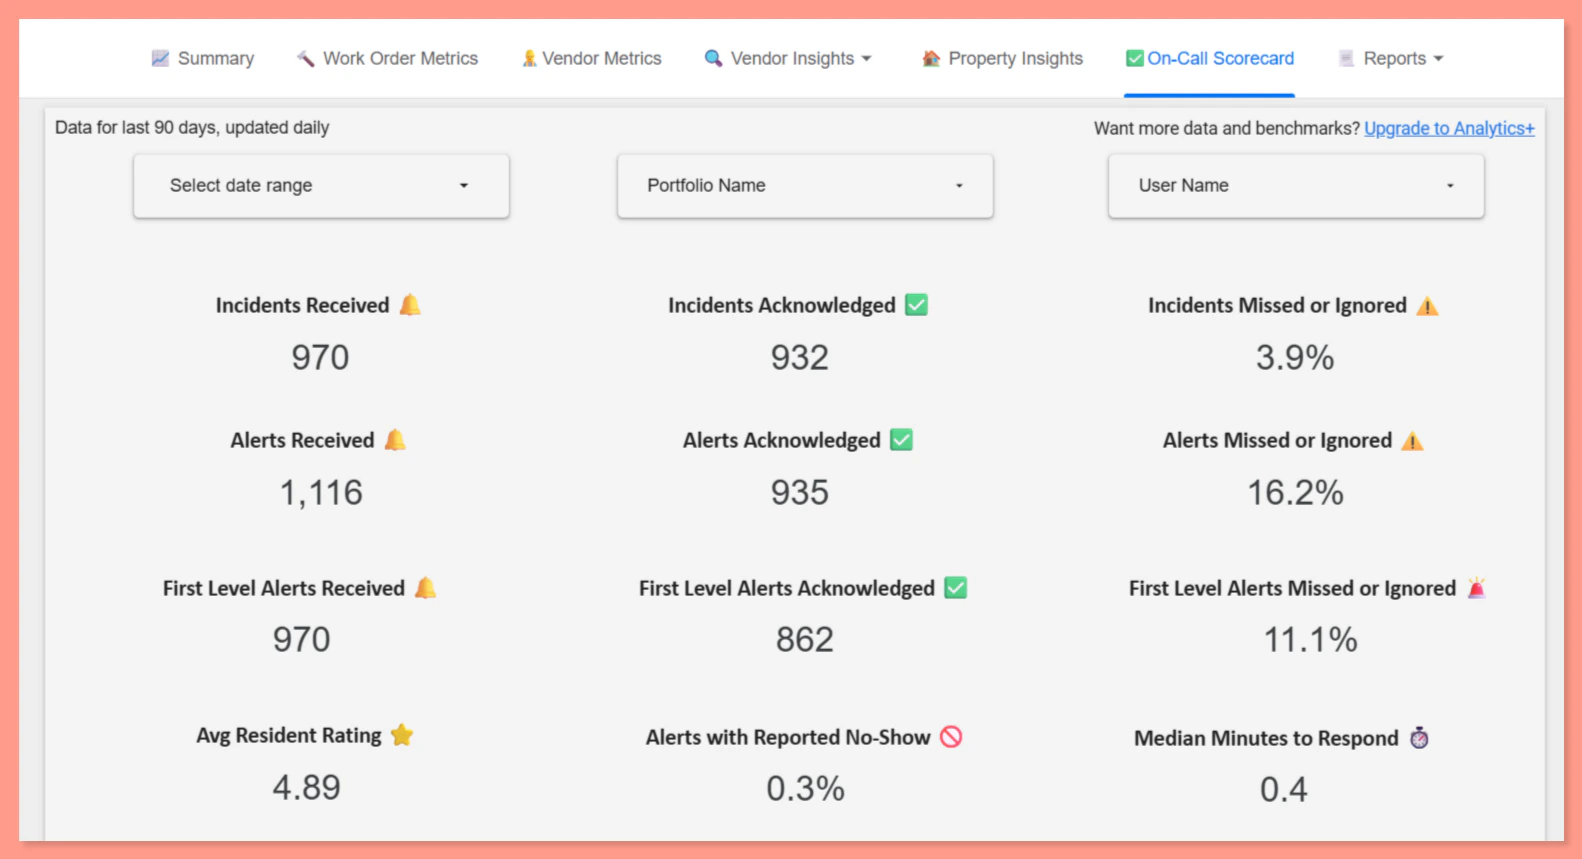
Reports Section
This section allows property managers to quickly export key data such as resident lists, invoices, and property records.Latchel Analytics: Reports Section
Export and access key data like residents, invoices, properties, and work orders for easy reporting and record-keeping.
Analytics +
Want to learn how this premium service? Check the guide below.Getting Started with Analytics+
This guide explains what Analytics+ is, how it differs from standard Analytics, and what’s included.
Other Latchel Analytics Articles
Register Your Existing Email with Gmail for Latchel Analytics Access
Set up your existing email with Google to securely access Latchel Analytics.
Custom Reporting and Benchmarks Usage Details
Learn how to build custom reports and use benchmarks to measure performance across your portfolio.
Using the Filters
Refine your data by applying filters to focus on the metrics and insights that matter most.
Exporting Reports
Download or share your analytics data and visuals for reporting and deeper analysis.
Provide Feedback
Share your thoughts on Latchel Analytics to help improve features and performance.